

Published by AgamiSoft | Reading time: ~14 minutes
|
Featured Snippet / AEO Answer: Mobile app performance optimization is the systematic process of reducing load times, eliminating crashes, minimizing memory usage, and improving responsiveness to keep users engaged and converting. In 2026, users expect apps to launch in under 3 seconds 70% abandon apps that take too long, and every additional second of load time reduces conversions by up to 20%. Optimization targets four layers: code efficiency, asset handling, network calls, and runtime monitoring.
|
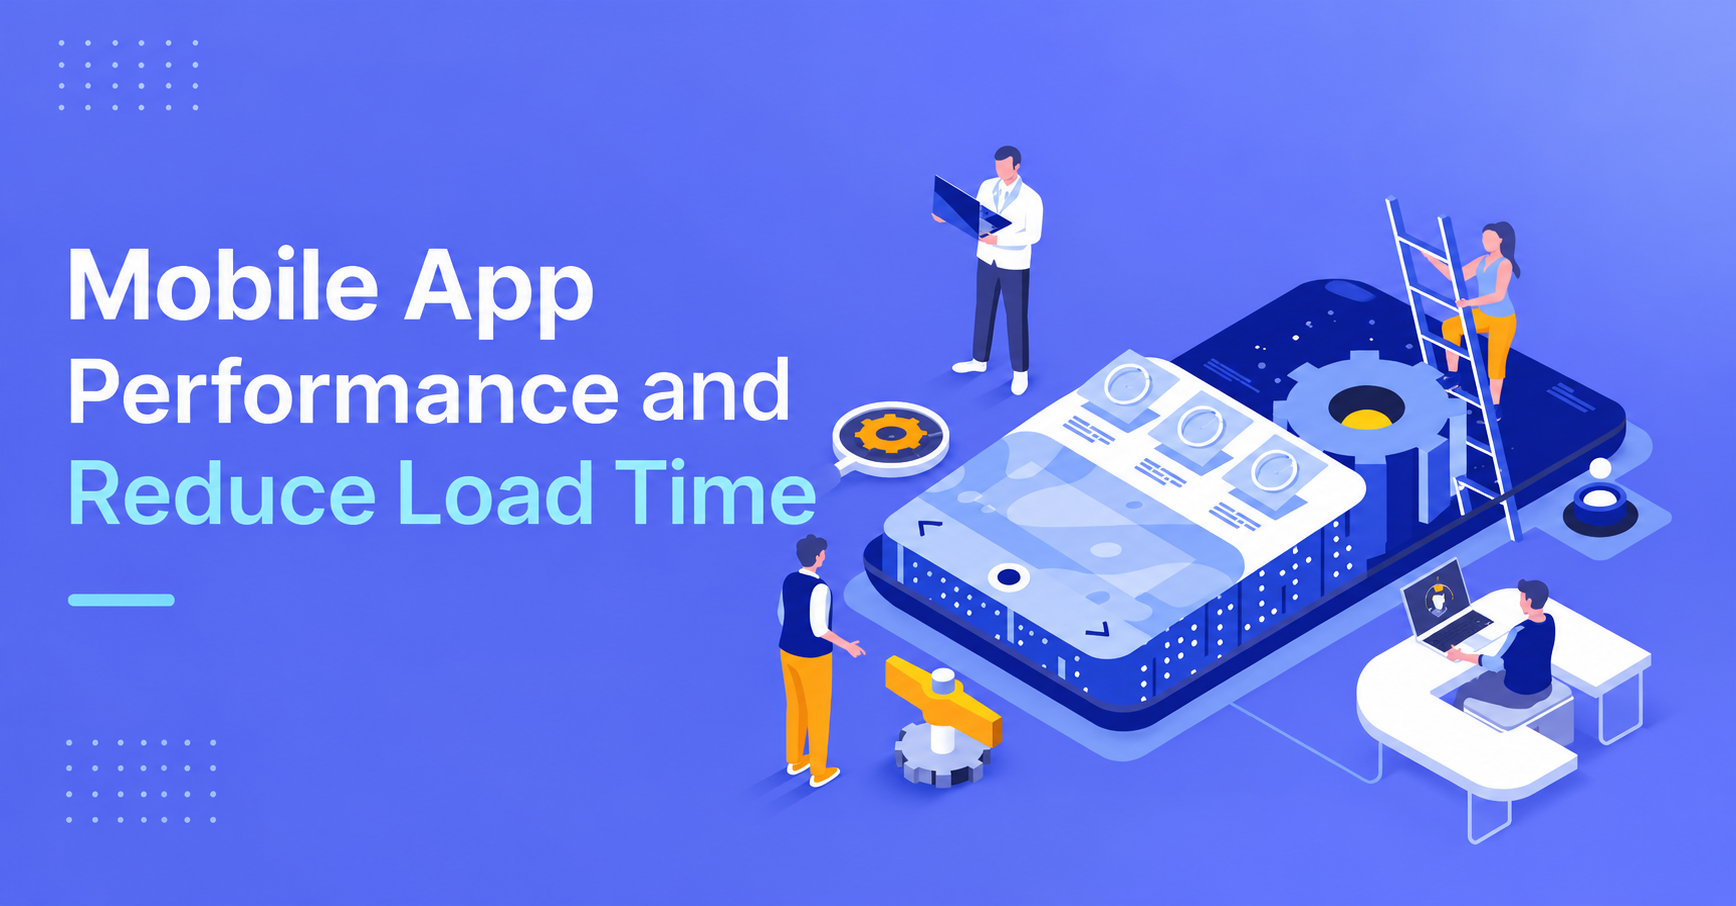
Mobile App Performance Optimization: How to Reduce Load Time and Retain More Users in 2026
|
Quick Answer / TL;DR: By early 2026, users expect apps to load in 2–3 seconds. 70% abandon apps that take too long. 62% uninstall immediately after crashes. Each 1-second delay reduces conversions by up to 20%. The most effective path to better performance is not a rewrite it is a diagnosis of where your specific app loses time, applied to four optimization layers: code efficiency, asset delivery, API calls, and runtime monitoring.
|
Why Mobile App Performance Optimization Has Become a Revenue Decision in 2026
Performance crossed from a technical concern to a business metric in 2026. The evidence is specific: every additional second of load time reduces conversions by up to 20% (The Droids on Roids, 2026). For a $1 million revenue app, one extra second of lag costs $200,000 annually. Sites and apps that load in 5 seconds earn 2x more mobile ad revenue compared to those taking 19 seconds (The Droids on Roids, 2026).
The user behavior data makes the stakes concrete. 70% of users abandon apps that take too long to load, and 62% will uninstall an app immediately if it crashes (ContentSquare, 2025). 61% of users won't wait more than 5 seconds for an app to launch, and 72% of users abandon apps within the first 30 days often due to performance issues (The Droids on Roids, 2026). 60% of users will uninstall after just a few crashes (Embrace Mobile Performance Report, cited in VWO, 2026).
The market context amplifies the urgency. There are 5.78 billion unique mobile users worldwide in 2026, representing 70.1% of the global population (DataReportal, Digital 2026). Mobile now accounts for 77% of all digital traffic, a 5% increase from the prior year (Quantum Metric, 2026). Every percentage point of conversion lost to performance problems operates against a traffic baseline that is growing.
The positive case is equally documented. Optimized apps see 25–70% conversion improvements in companies implementing systematic mobile app optimization (The Droids on Roids, 2026). Flipkart's performance optimization produced a 70% increase in conversions and a 300% improvement in session duration from 70 seconds to 3.5 minutes by addressing real-world network constraints for their user base (The Droids on Roids, 2026). Performance optimization is the highest-leverage category of engineering investment for any app with a revenue model attached to user engagement.
What Mobile App Performance Optimization Actually Covers
Mobile app performance optimization is the continuous process of identifying and eliminating the specific technical barriers that slow an app's startup time, increase its crash rate, drain device resources unnecessarily, and introduce latency between user actions and system responses. It is not a one-time project it is an ongoing discipline that intersects engineering, product, and analytics.
Performance optimization covers four distinct technical layers, each with its own failure modes and optimization techniques:
-
Code efficiency How much computational work the app performs to complete each operation; covers rendering, logic processing, and thread management
-
Asset delivery How images, fonts, videos, and static resources are sized, compressed, cached, and loaded; typically the largest contributor to first-load latency
-
Network and API efficiency How many network calls the app makes, how large the payloads are, and how intelligently the app handles caching and failure
-
Runtime monitoring How the team detects, diagnoses, and fixes performance regressions in production, before they affect large user segments
The performance benchmarks that define the 2026 standard:
|
Metric |
Target |
Critical Threshold |
|
App startup time (cold launch) |
Under 2 seconds |
Over 3 seconds = high abandonment risk |
|
App startup time (warm launch) |
Under 1 second |
|
|
Crash rate |
Below 1% of sessions |
Above 2% triggers app store ranking impact |
|
ANR rate (App Not Responding) |
Below 0.5% |
Google Play surfaces ANR data in Play Console |
|
API response time |
Under 500ms |
Over 2 seconds causes visible lag |
|
Memory usage |
Within device-class norms |
Memory spikes cause ANRs and background kills |
Sources: The Droids on Roids (2026); Survicate (2026); LoadFocus (2026).
The performance budget is the governance tool that keeps these targets operational. Define explicit targets for each metric before any sprint, measure them in CI/CD, and treat a build that violates the performance budget the same way you treat a build that breaks a unit test: as a blocking failure, not a deferred concern.
The Numbers: What Performance Gains Actually Deliver
These figures come from 2025–2026 research, case studies, and published app analytics data. They establish both the cost of poor performance and the magnitude of improvement achievable through optimization.
On the cost of slow and unstable apps:
-
70% of users abandon apps that take too long to load (ContentSquare, 2025)
-
62% uninstall immediately after crashes (ContentSquare, 2025)
-
61% won't wait more than 5 seconds for app launch (The Droids on Roids, 2026)
-
72% abandon apps within the first 30 days, primarily due to performance issues (The Droids on Roids, 2026)
-
Each 1-second delay in load time reduces conversions by up to 20% (The Droids on Roids, 2026)
-
A 3-second load time produces 3x more bounce rate than a 1-second load time (Google PageSpeed Insights benchmark data)
On what optimization delivers:
-
Optimized apps see 25–50% improvements in Day 30 retention rates (The Droids on Roids, 2026)
-
Companies implementing systematic optimization see 25–70% conversion improvements (The Droids on Roids, 2026)
-
Flipkart PWA: 70% increase in conversions, 300% improvement in session duration (from 70s to 3.5 minutes) (The Droids on Roids, 2026)
-
Apps loading in 5 seconds earn 2x more mobile ad revenue than those loading in 19 seconds (The Droids on Roids, 2026)
-
Reducing form fields and friction points in mobile onboarding flows produces conversion improvements of 50–120% in documented CRO studies (HubSpot; Unbounce)
On the business case for making performance a product priority:
-
Over 30% of developers in 2026 now cite performance as their top development priority up significantly from prior years (LoadFocus, 2026)
-
Google continues to use app speed and stability as ranking signals in both Google Play and Google Search, making performance optimization an ASO and SEO lever in addition to a UX one
How to Optimize Mobile App Performance: A 6-Stage Framework
This framework moves from measurement to sustainable monitoring. Each stage builds on the previous one you cannot optimize what you haven't measured, and you cannot sustain improvements without ongoing monitoring.
Stage 1: Establish Your Performance Baseline
Before writing a line of optimization code, instrument your app to measure its current performance against the benchmark targets above. You cannot improve what you haven't measured, and you cannot validate that an optimization worked without a before-and-after comparison.
Instruments to deploy in baseline measurement: startup time (cold and warm launch), measured at the P50, P75, and P95 percentiles not just the average; crash rate by device class, OS version, and geography; ANR rate; memory usage across typical user sessions; API response times for each endpoint the app calls; and network payload sizes for the top 10 user flows.
The P95 startup time is the most actionable single metric for most teams it captures the experience of your slowest 5% of users, who are almost always on older devices with slower networks, and who are disproportionately likely to churn.
Stage 2: Optimize Code Efficiency
Profile the app's execution to identify where CPU time is actually spent not where you assume it's spent. For Android, Android Studio Profiler provides CPU, memory, network, and energy profiling. For iOS, Xcode Instruments provides the same capability.
Common high-impact code efficiency fixes:
-
Move all network calls, database queries, and image processing off the main thread. Any operation on the main thread that takes over 16ms (the frame budget for 60fps rendering) produces visible lag.
-
Defer non-critical initialization. If the app's cold launch initializes 40 third-party SDKs synchronously before showing the first screen, move all non-critical SDK initialization to after the first screen renders.
-
Implement lazy loading for screens and features the user hasn't navigated to yet. Parsing and compiling all code at startup is the most common cause of slow cold launch times.
-
Audit and minimize third-party SDK usage. Each SDK adds initialization time, memory overhead, and network call volume. Integrating third-party SDKs can slow response times and increase network calls significantly (VWO, 2026).
Stage 3: Optimize Asset Delivery
Images and video are typically the largest contributors to first-load latency and ongoing memory pressure. Apply these optimizations in order of impact:
-
Use modern image formats WebP for Android, HEIF for iOS which reduce file size by 25–35% versus JPEG/PNG at equivalent visual quality
-
Implement adaptive image loading: serve image dimensions matched to the screen size and resolution actually displaying them, not the maximum-resolution version for all devices
-
Compress all images to the minimum quality level that is perceptually indistinguishable at the target display size
-
Cache aggressively: use HTTP cache headers, local disk cache (Room for Android, Core Data for iOS), and in-memory caching for frequently accessed assets
-
Prefetch assets for the next likely user action, but limit prefetch to high-confidence next steps unnecessary prefetching consumes bandwidth and battery
Stage 4: Optimize Network and API Calls
Network latency is the optimization category that most directly affects users on poor connections which in most markets represents a substantial portion of your user base.
-
Reduce payload size: compress JSON responses with gzip or brotli; pagination for large datasets; GraphQL for clients that need variable subsets of large objects
-
Implement request batching where multiple sequential API calls can be combined into one
-
Cache API responses aggressively for data that doesn't change frequently; invalidate cache specifically rather than broadly
-
Design graceful degradation: the app should remain functional and display cached data when network requests fail, rather than showing a blank screen or crash
-
Implement optimistic UI: reflect the user's action immediately in the interface while the network request is in-flight, rather than blocking the UI while waiting for a server response
Stage 5: Test Under Real-World Conditions
Performance that holds up in the simulator and fails on a real device is not optimization it is a false positive. Test on actual devices representing your user base's hardware distribution, not just on the latest flagship hardware your engineering team uses.
Test specifically under:
-
Slow 3G network conditions (Chrome DevTools network throttling; Android Emulator network conditioning)
-
Low-memory device profiles (older Android devices with 2–3 GB RAM are still widely used in Asia and developing markets)
-
Background app restoration (warm launch after the device killed the app in the background due to memory pressure)
-
Geographic variance (CDN latency differs significantly by region)
Load testing under concurrent users is required before major feature launches or marketing campaigns that will spike traffic. Integrating load testing with CI/CD ensures every build is tested under real-world load no surprises post-release (LoadFocus, 2026).
Stage 6: Monitor, Alert, and Iterate in Production
Performance optimization is not a sprint it is a monitoring discipline. Apps that optimize at launch and stop monitoring discover regressions in the next release, under holiday traffic spikes, or as the device ecosystem evolves.
Deploy production monitoring that automatically alerts on:
-
Crash rate exceeding the performance budget threshold
-
ANR rate exceeding 0.5%
-
P95 startup time exceeding 3 seconds
-
API error rate exceeding 1% for any critical endpoint
Connect production monitoring to your development workflow so that alerts generate tickets automatically, and establish a performance review cadence weekly for high-growth apps, monthly for stable apps where the team reviews trend data and owns specific metric improvements.
Tools for Mobile App Performance Optimization in 2026
Profiling and diagnosis:
-
Android Studio Profiler CPU, memory, network, and energy profiling for Android. The mandatory first tool for any Android performance investigation.
-
Xcode Instruments (Time Profiler, Leaks, Network) The equivalent for iOS. Time Profiler identifies CPU hotspots; Leaks surfaces memory allocation issues; Network traces all network activity.
Real-device testing and load testing:
-
Firebase Test Lab Cloud-based testing on real Android and iOS devices across device configurations. Surfaces device-specific crashes and performance issues before release.
-
LoadFocus Cloud load testing platform for mobile apps. Simulates concurrent user traffic to identify performance bottlenecks before scaling events.
Production monitoring and crash reporting:
-
Firebase Crashlytics Real-time crash reporting with device, OS, and user segmentation. The standard Android crash monitoring tool; also available for iOS.
-
Sentry Cross-platform error and performance monitoring with session replay. Strong for teams managing both mobile and web applications in a unified observability platform.
-
Embrace Mobile-specific performance monitoring covering crash rates, ANR rates, startup time trends, and network performance. Published the mobile performance benchmark report cited earlier in this article.
-
Datadog Mobile Real User Monitoring Enterprise-grade mobile RUM with full session tracing, custom metric alerting, and correlation between mobile performance and backend service latency.
Image optimization:
-
Cloudinary CDN-backed image optimization and transformation that automatically serves WebP or HEIF formats, responsive image sizes, and compressed assets.
-
Squoosh (Google) Open-source image compression tool for batch-optimizing image assets during the build pipeline.
What Goes Wrong: The 5 Most Expensive Mobile Performance Mistakes
1. Profiling only on the development team's devices.
Engineers develop on the latest flagship hardware with fast Wi-Fi and no background apps competing for memory. Real users run your app on three-year-old mid-range Android devices on 4G in a commuter tunnel. The startup time that feels instant on a Pixel 9 may take 4+ seconds on a Samsung Galaxy A33 and the Samsung is the more common device in your user base. Establish a test device matrix representing your actual P75 user device profile and test performance specifically on those devices before shipping any release.
2. Counting crash rate from crash reports only.
Many crashes are not reported to crash tracking tools because the app terminates before the crash reporter can flush its buffer. In-app crash rate from Firebase Crashlytics or Sentry typically undercounts by 10–30%. Use Google Play Console's Android Vitals or Apple's Crash Organizer in App Store Connect alongside your SDK-based crash reporter these sources capture device-level crash signals that SDK-based tools miss.
3. Adding third-party SDKs without auditing their startup cost.
Analytics SDKs, A/B testing SDKs, customer data SDKs, support chat SDKs each one added to an app contributes initialization time, memory overhead, and network call volume. An app that starts development with 3 SDKs and ships with 12 has typically added 400–800ms of launch latency without anyone making an explicit decision to do so. Audit every SDK for initialization overhead before adding it, and require that new SDKs defer initialization until after first render.
4. Treating performance optimization as a separate project from feature development.
Performance regressions introduced by new features are detected weeks or months after shipping, at which point attribution is difficult and fixing them requires a dedicated sprint. Integrating performance testing into CI/CD automated startup time checks, crash rate gates, and API response time thresholds that block the release pipeline when violated catches regressions at the pull request stage, where the fix is the smallest possible change to the newest possible code.
5. Optimizing averages without investigating the long tail.
An average app startup time of 2.1 seconds looks healthy. A P95 startup time of 6.8 seconds means one in twenty users experiences a launch time that exceeds the abandonment threshold on every session. Performance optimization that targets the average leaves the worst-served users entirely unaddressed. Segment all performance metrics by device class, OS version, geography, and network type, and build your optimization roadmap from the long-tail experience, not the median.
FAQ
How do I improve mobile app performance?
Improve mobile app performance by working through four optimization layers in sequence: code efficiency (move blocking operations off the main thread, defer non-critical initialization, implement lazy loading for non-visible screens); asset delivery (use WebP/HEIF image formats, serve responsive image sizes, cache aggressively); network optimization (reduce API payload sizes, batch network calls, implement graceful offline degradation); and runtime monitoring (deploy crash reporting, ANR alerting, and startup time trend monitoring in production). Establish performance budgets before optimizing load time under 3 seconds, crash rate below 1%, ANR rate below 0.5% and treat any violation as a release blocker.
What causes slow mobile app load times?
The most common causes of slow app load times are: synchronous third-party SDK initialization on the main thread before the first screen renders; uncompressed or oversized image assets loaded before the visible viewport; undeferred code parsing and compilation for features the user hasn't navigated to; serial API calls that could be parallel or batched; and excessive startup work performed in the Application/AppDelegate class before the UI is visible. The fastest path to diagnosing which specific cause applies to your app is the Android Studio CPU Profiler or Xcode Time Profiler, which attribute startup time to specific methods and can be run in minutes.
How do I reduce mobile app load time?
Reduce mobile app load time by prioritizing three changes: lazy-load all non-critical initialization (including third-party SDKs) to after the first screen renders; compress and cache images using WebP/HEIF format with adaptive sizing; and move all network calls and database queries off the main thread to prevent UI blocking. These three changes typically produce 30–60% reduction in cold launch time for apps that haven't been previously optimized. After implementing them, run Firebase Test Lab or equivalent cloud device testing to verify improvements under the actual device profiles your users run.
Conclusion: Performance Is a Product Feature, Not a Technical Cleanup Task
The apps retaining 25–50% more users at Day 30 and converting at 70% higher rates are not built on different technology stacks. They are built on the same technology, with performance treated as a first-class product requirement from the first sprint with performance budgets defined before development, tests run in CI/CD, and monitoring in production before the first user session.
Every second your app takes to load is a conversion tax. Every crash is a churn event. Both are diagnosable and both are reducible, with the framework above, on your actual device distribution, against your actual user base.
Your immediate action: pull your P95 cold launch time and your crash rate from Google Play Console Android Vitals or Apple App Store Connect Crash Organizer this week. If startup time exceeds 3 seconds at P95 or crash rate exceeds 1%, that is your performance budget deficit and the Stage 2 code profiling in the framework above is where the diagnosis starts.
Related reading: For the mobile analytics and monitoring infrastructure that sustains these gains in production, see our companion guides on mobile app performance monitoring and mobile app A/B testing to build the measurement foundation your optimization program requires.