

Published by AgamiSoft | Reading time: ~14 minutes
|
Featured Snippet / AEO Answer: Website traffic but no leads is almost never a traffic problem it is a conversion diagnosis problem. The five most common causes are intent mismatch (the wrong visitors arriving), weak value proposition (visitors not understanding what you offer within 5 seconds), UX friction (forms, load speed, and navigation blocking action), missing trust signals (visitors uncertain your solution is credible), and CTA failure (calls-to-action that don't match the visitor's readiness to commit).
|
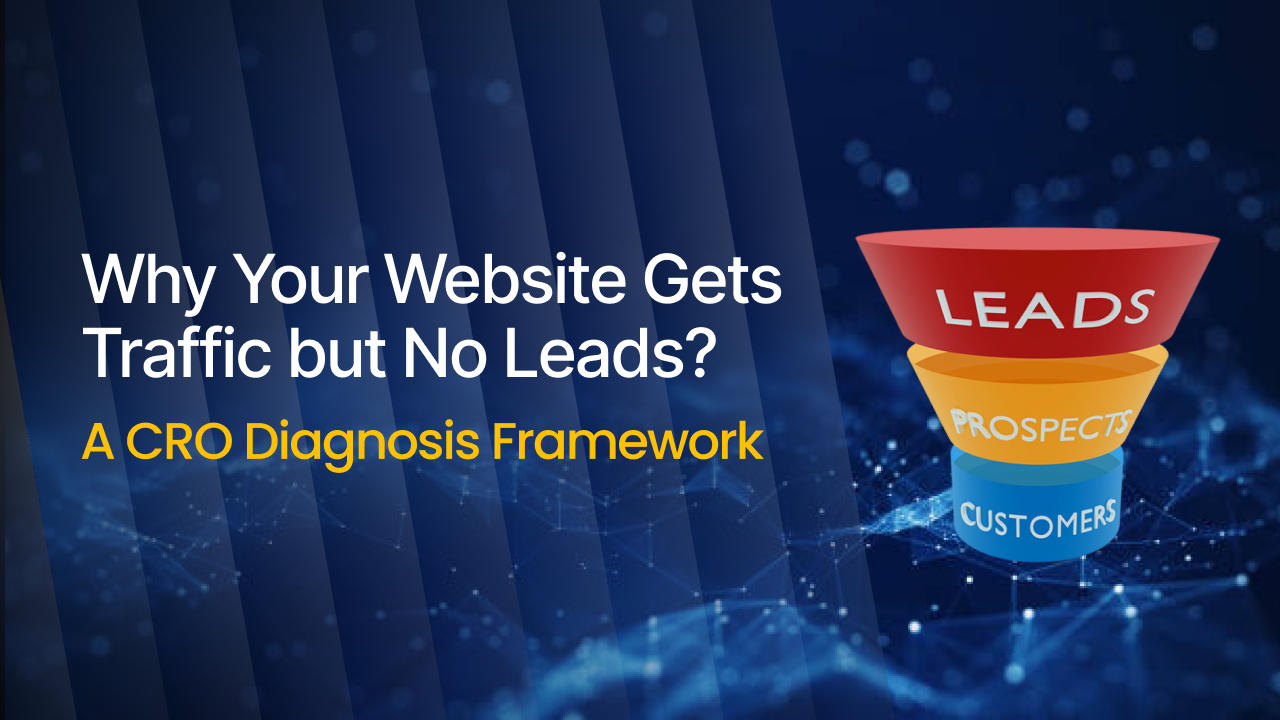
Website Traffic But No Leads? A CRO Diagnosis Framework That Finds the Real Problem
|
TLDR; Quick Answer / TL;DR: The average website converts 2.35% of visitors. Top-performing websites convert 11%+ (WordStream). The difference between them is not traffic volume it is diagnosis quality. Traffic without leads is a signal that something specific is blocking conversion at a specific point in the visitor journey. This framework locates that specific point in five diagnostic stages, without guessing. |
Why Getting Website Traffic But No Leads Has Become the Most Misdiagnosed Growth Problem in 2026
The most common response to "we're getting traffic but no leads" is to order more traffic. More ads, more SEO effort, more content. The result: more traffic, still no leads and a higher marketing spend with the same conversion rate on a larger denominator.
The instinct is understandable but structurally wrong. Traffic is not the asset your business needs more of conversion is. A website converting at 1% that doubles its traffic doubles its leads. A website converting at 0.2% that doubles its traffic still returns a fraction of what a 1% conversion rate would produce at the original traffic level. The math on fixing conversion before scaling traffic is unambiguous.
The median B2B website conversion rate sits between 2.23% and 4.31% depending on industry (Ruler Analytics, 2025). Software and SaaS conversion rates average around 3% for form-based lead capture (WordStream). Top performers in every category run 5–11%+ not because they have better traffic, but because they removed the specific barriers that stopped their visitors from converting. Identifying those barriers is a diagnostic discipline, not a creative one.
The problem in 2026 is that most growth teams use traffic metrics to diagnose conversion problems they check session counts, bounce rates, and channel attribution when the diagnosis requires behavior data: where visitors leave, what they click, what they don't, and what they tell the sales team they were confused about. Traffic data describes the audience. Behavior data describes the blockage. This framework uses both.
Why Website Traffic But No Leads Is a Diagnosis Problem, Not a Traffic Problem
Conversion rate optimization (CRO) is the discipline of increasing the percentage of website visitors who take a defined action submitting a lead form, booking a demo, starting a trial without increasing the traffic required to produce that action. It treats the website as a conversion system with identifiable failure points, not as a brochure that either works or doesn't.
The traffic-but-no-leads pattern has five diagnostic root causes. Each one looks similar at the surface (no leads) and requires a different fix:
-
Intent mismatch The visitors arriving are not the ones your offer is designed for. This is a traffic quality problem that looks like a conversion problem. You're attracting informational searchers to commercial pages, or awareness-stage visitors to decision-stage offers.
-
Weak value proposition Visitors arrive on the right page for the right reason and still don't convert because they can't determine within 5 seconds what you offer, who it's for, and why they should trust you with it.
-
UX friction The visitor wants to convert but the website makes it too hard: slow load times, forms with too many fields, navigation that buries the CTA, or mobile experience that doesn't function.
-
Missing trust signals The visitor is interested but unconvinced. No case studies, no recognizable logos, no reviews, no evidence that others like them have made this decision and not regretted it.
-
CTA failure The call-to-action asks for more commitment than the visitor is ready to give. "Book a Demo" converts at a fraction of the rate of "See How It Works" for visitors who haven't yet confirmed the product is relevant to them.
The reason these five causes matter: each one requires a different fix. Misdiagnosing a trust problem as a traffic problem adds more ad spend. Misdiagnosing an intent problem as a UX problem rebuilds the landing page for the wrong audience. Correct diagnosis is the prerequisite for the correct intervention.
The Numbers: What the Conversion Data Actually Says
These figures establish the baseline that converts the "we have a conversion problem" observation into a measurable gap with a prioritizable fix.
On conversion rate benchmarks:
-
The average website conversion rate across all industries: 2.35%; top quartile: 5.31%; top 10%: 11.45%+ (WordStream)
-
B2B website conversion rates by industry: Business Services 2.7%, Finance 5.01%, Healthcare 2.5%, Software/SaaS 3.0% (Ruler Analytics, 2025)
-
Average landing page conversion rate: 2.35%; dedicated landing pages convert 2–5x higher than homepages for the same offer (WordStream)
On the cost of not fixing conversion:
-
Businesses lose $1.6 trillion annually due to poor UX that drives customers away (Forrester Research)
-
A 1% improvement in conversion rate can generate significantly more revenue than a corresponding 1% increase in traffic at the same conversion rate
On what blocks conversion:
-
53% of mobile visitors abandon a site that takes longer than 3 seconds to load (Google)
-
Reducing form fields from 11 to 4 increased conversions by 120% in HubSpot's own CRO experiment (HubSpot)
-
Pages with video convert 86% better than those without on landing pages for complex B2B products (Unbounce)
-
Websites that include customer testimonials see 34% higher conversion rates versus those without (BigCommerce)
-
Changing a CTA from "Request a Free Quote" to "Get My Free Quote" increased conversion by 90% in a Unbounce test the single-word change from second to first person (Unbounce)
On intent mismatch as the most under-measured conversion killer:
-
The single most common cause of traffic-but-no-leads in B2B is attracting informational-intent searchers ("what is X," "how does X work") to commercial-intent pages ("pricing," "demo," "buy") a traffic quality problem that Google Analytics session data doesn't surface without segmentation by search query intent (Search Engine Land, 2025)
The CRO Diagnosis Framework: 5 Stages to Find the Blockage
Work through these stages in order. Stop at the stage that confirms a specific blockage and fix it before moving to the next. Running all five stages simultaneously without fixing the highest-impact finding first distributes effort without compounding it.
Stage 1: Confirm the Intent Match
Pull your top traffic-generating pages and match them against the search queries driving that traffic. In Google Search Console, filter by landing page, then by the top queries arriving on that page. Ask: is the page delivering what a visitor with that query intent needs? A page ranking for "what is [category]" is serving informational intent those visitors are not ready to convert, and putting a demo CTA above the fold on that page will produce a low conversion rate regardless of how well-designed the CTA is. Either create a separate conversion-optimized page for commercial intent queries, or restructure the page to serve commercial intent visitors with a clear next step.
Stage 2: Test the 5-Second Value Proposition
Load your highest-traffic landing page cold. Without scrolling, answer three questions: What does this company do? Who is it for? Why should I trust them with my problem? If you can't answer all three within five seconds, neither can your visitor. The above-the-fold content headline, subheadline, and primary CTA must answer those three questions before asking for any commitment. Run a 5-second test via UsabilityHub or Maze by showing the page to five people outside your industry for exactly five seconds and asking what they think the company does. The answers will locate your value proposition gap faster than any analytics tool.
Stage 3: Map the Friction Points
Install Hotjar, Microsoft Clarity, or FullStory and collect at minimum 500 session recordings on your highest-traffic pages. Look for: rage clicks (repeated clicking on elements that aren't clickable), dead zones (content that receives zero engagement), form abandonment fields (the specific field where visitors leave the form without submitting), and scroll depth patterns (what percentage of visitors see your primary CTA before leaving). Each of these behaviors is a specific friction signal pointing to a specific fix. A rage click on a non-clickable element means visitors expect that element to do something make it clickable or change the design to eliminate the expectation. Form abandonment at the "Company Size" field means that field is creating friction test removing it.
Stage 4: Audit Trust Signals
Identify the five trust signals your target buyer needs to see before converting and check whether each one is present, prominent, and credible on the conversion path. For B2B SaaS: recognizable customer logos, case studies with named companies and quantified outcomes, third-party review ratings (G2, Capterra), security certifications (SOC 2, ISO 27001 for enterprise buyers), and founder or team credibility indicators. Missing trust signals don't produce objections they produce silence. The visitor simply leaves without telling you they weren't convinced.
Stage 5: Test the CTA Commitment Level
Map your primary CTA to the buyer's readiness level at each stage of the funnel. A visitor on a blog post reading a "what is" article is not ready to "Book a Demo" they are ready to "Download the Guide" or "See How Companies Like Yours Use [Product]." A visitor on a pricing page comparing plans is closer to demo-ready, but "Start Free Trial" often converts higher than "Request Demo" because it reduces the commitment. Test one CTA variant per page per month using a tool like VWO or Google Optimize, using a single variable per test (CTA text, CTA color, CTA placement) and a minimum of 1,000 visitors per variant before reading results.
Tools for CRO Diagnosis and Optimization
-
Hotjar / Microsoft Clarity Session recording, heatmaps, and scroll maps for Stage 3 friction identification. Clarity is free with no session limits; Hotjar charges by session volume above the free tier.
-
Google Search Console The primary tool for Stage 1 intent matching. Filter by landing page to see the exact queries driving traffic to each page, then match query intent to page purpose.
-
UsabilityHub / Maze 5-second tests for Stage 2 value proposition auditing. Both platforms provide fast, cheap access to test participants outside your industry.
-
VWO / Google Optimize (via GA4 experiments) A/B testing platforms for Stage 5 CTA optimization. VWO provides a WYSIWYG editor for non-developer testing; GA4 experiments are free for teams already using Google Analytics.
-
HubSpot / Unbounce / Webflow Landing page builders with built-in A/B testing and form analytics. Unbounce's AI-powered Smart Traffic routes visitors to the variant most likely to convert based on their attributes.
-
FullStory Enterprise session intelligence with quantitative session data (not just recordings) surfacing rage click frequency, form abandonment rates by field, and dead-zone percentages at scale. Used by enterprise teams that need statistical confidence rather than qualitative observation.
What Goes Wrong: The 5 Most Expensive CRO Diagnosis Mistakes
1. Buying more traffic before fixing conversion.
The math is consistently unfavorable: doubling traffic at 0.5% conversion produces the same leads as fixing conversion to 1% at the original traffic volume at a fraction of the cost, with a permanent improvement that compounds. Run the CRO diagnosis before the next ad budget increase. Find and fix one high-impact conversion blocker. Then scale the traffic that now converts.
2. Testing aesthetics instead of messaging.
Changing button colors, font sizes, and hero image photography is the most common form of CRO theater optimization that measures easily and rarely moves conversion meaningfully. The highest-impact CRO tests change the message: the headline's value proposition, the CTA's commitment level, the proof point visible above the fold. Run messaging tests first, aesthetic tests after you've exhausted the message variables.
3. Reading conversion rate as a site-level metric.
A site-wide conversion rate of 2% is an average that hides the specific pages failing and the specific pages over-performing. A blog post converting at 0.1% and a pricing page converting at 8% average to something meaningless. Diagnose at the page level, by traffic source, by device type, and by query intent. The fixes are page-specific and source-specific site-level averages can't locate them.
4. Drawing conclusions from statistically insignificant tests.
An A/B test with 200 visitors per variant and a 7-day runtime is not statistically significant it is a sample too small to distinguish real effects from random variation. Most CRO practitioners recommend a minimum of 1,000 visitors per variant and a minimum of two business cycles (typically two weeks) before reading results. Running tests too short produces false positives that lead to shipping changes that hurt conversion.
5. Treating the diagnosis as a one-time project.
The website that converts at 5% today will not convert at 5% in 12 months without maintenance. Buyer expectations change, competitors improve, your traffic mix shifts, and offers that resonated last year lose relevance. CRO is a continuous measurement and improvement practice, not a campaign. Schedule quarterly conversion audits using the Stage 1–5 framework above, and treat the conversion rate as a metric your team owns and improves continuously the same way your team treats traffic, pipeline, and revenue.
FAQ
Why is my website getting traffic but no leads?
Website traffic without leads is almost always caused by one of five specific problems: intent mismatch (visitors arriving who aren't your target buyer), weak value proposition (visitors can't determine what you offer within 5 seconds), UX friction (forms, load speed, or navigation blocking action), missing trust signals (visitors unconvinced by lack of social proof), or CTA mismatch (asking for more commitment than visitors are ready to give). Diagnosing which specific problem applies to your site requires behavior data session recordings, heatmaps, scroll depth maps, and form abandonment analytics not just traffic metrics.
How do I fix my website's conversion rate?
Fix your website's conversion rate by working through five diagnostic stages in order: confirm that your traffic intent matches your page's conversion goal; test whether visitors can articulate your value proposition within 5 seconds; map friction points using session recordings and heatmaps; audit whether the trust signals your target buyer needs are visible on the conversion path; and test CTA variants to find the commitment level that matches visitor readiness. Fix the highest-impact blocker identified in each stage before running the next test. One specific fix implemented correctly compounds fixing five things simultaneously makes attribution impossible.
What causes high traffic with low conversions?
High traffic with low conversions is most commonly caused by intent mismatch the majority of your traffic is arriving from informational searches rather than commercial intent queries, and informational searchers are not ready to convert to a lead form or demo request. Check Google Search Console for the top queries arriving on your highest-traffic pages. If those queries are informational ("what is," "how does," "difference between") rather than commercial ("pricing," "cost," "solution for," "best [category]"), your conversion rate will be structurally low regardless of how optimized the page is because you're selling to browsers, not buyers.
Conclusion: The Traffic Is Not the Problem. The Diagnosis Is the Starting Point.
Every high-traffic, low-conversion website has at least one specific, diagnosable blockage in the five categories above. The blockage is not invisible it shows up in session recordings as rage clicks, in scroll maps as invisible CTAs, in Search Console as intent-mismatched queries, and in form analytics as abandonment on a specific field. The businesses converting at 11%+ didn't start with better traffic. They started with a better diagnosis.
Your immediate action: open Google Search Console and filter by your three highest-traffic pages. Look at the top 10 queries arriving on each page. If more than half are informational-intent queries on a page designed for commercial conversion, you've identified your highest-impact problem in under 15 minutes without a single A/B test, redesign, or new traffic campaign.
Related reading: For the full optimization discipline that turns this diagnosis into a continuous growth system, see our companion guides on landing page conversion optimization and lead generation website architecture to build the conversion infrastructure your traffic deserves.